
Home / Top 10 RCM Metrics Every Behavioral Health Provider Should Track

Managing revenue in behavioral health practices can be tricky, with challenges like recurring claims, high denial rates, and strict compliance requirements.
Tracking the right Revenue Cycle Management (RCM) metrics can help you avoid financial pitfalls and improve cash flow.
Here are the 10 key metrics every behavioral health provider should track:
Clean Claim Rate (CCR): Measures the percentage of claims accepted without errors. Aim for 95% or higher.
Claim Denial Rate: Tracks the percentage of rejected claims. Keep this under 5%.
First Pass Resolution Rate (FPRR): Reflects claims fully paid on the first try. Target 90% or above.
Days in Accounts Receivable (A/R): Shows how fast claims are paid. Behavioral health practices should aim for 30–40 days.
Net Collection Rate (NCR): Indicates how much revenue is collected versus what’s owed. A strong rate is 95%–99%.
Average Reimbursement Per Service: Helps evaluate payment trends by service type.
No-Show and Late Cancellation Rate: Tracks missed appointments, which can severely impact revenue.
Authorization and Eligibility Accuracy Rate: Ensures insurance details and prior authorizations are accurate to avoid denials.
Patient Responsibility Collection Rate: Measures success in collecting patient balances, especially with high-deductible plans.
Readmission and Return-to-Treatment Rate: Reflects clinical quality and can affect revenue in value-based care models.
Monitoring these metrics ensures better financial stability and reduces revenue leakage. Tools like automated claim scrubbing, eligibility checks, and patient payment portals can streamline processes and improve outcomes.
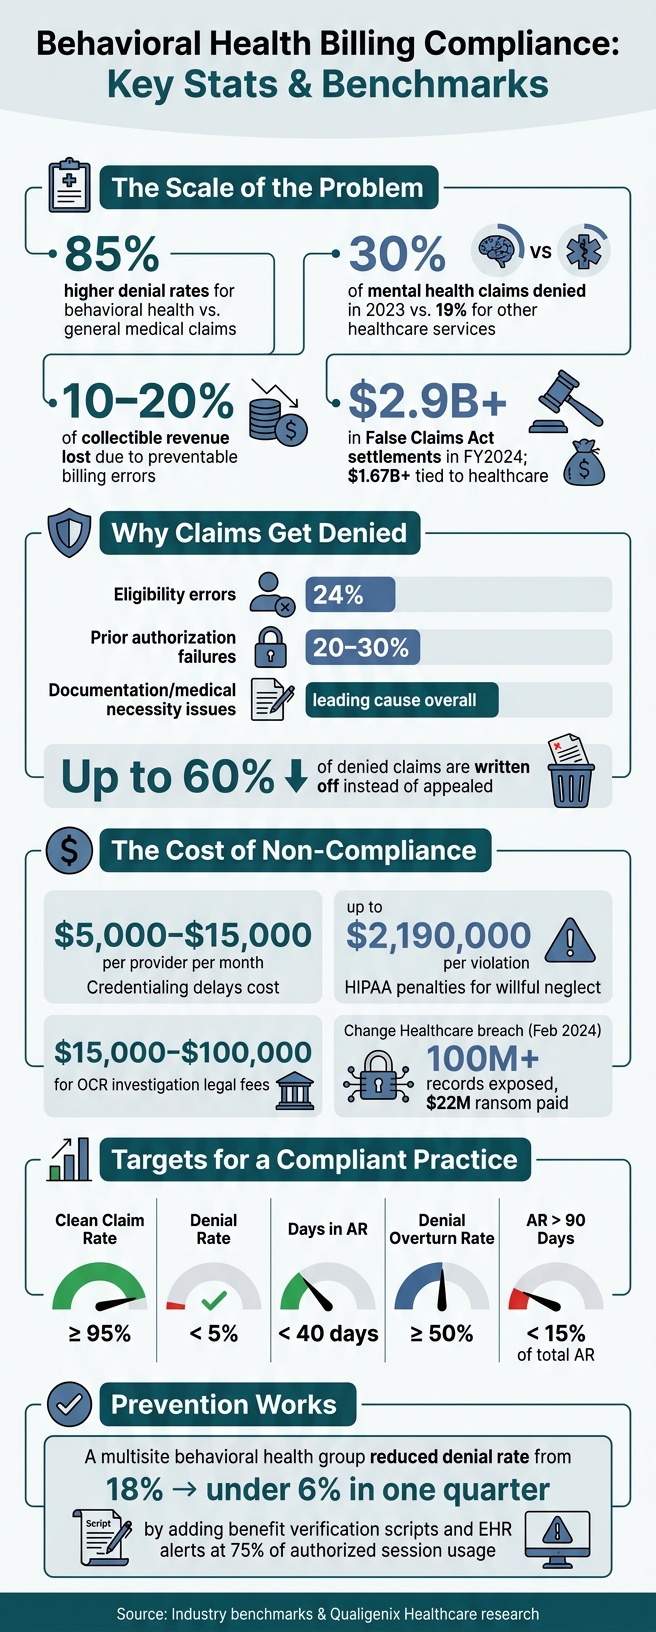
The clean claim rate (CCR) is all about efficiency – it’s the percentage of claims that get accepted and processed without errors or rejections on the very first try. To figure it out, take the number of claims successfully processed on the first submission, divide it by the total claims submitted, and multiply by 100. Simple math, but with big implications.
In behavioral health, this metric matters even more. Why? Weekly sessions mean that a single mistake – like entering the wrong member ID or using an expired authorization – can ripple across multiple claims, potentially leading to a noticeable hit to your revenue.
The industry sets the bar high with benchmarks at 95% or above. Top-performing behavioral health organizations often achieve rates between 97% and 99%. On the flip side, if your CCR is below 90%, it’s a red flag for deeper issues in your billing workflows [1]. Practices that don’t have specialized billing support typically see rates in the 65% to 80% range [2], which can severely impact cash flow. These numbers highlight the importance of accurate billing processes.
So, how can you improve? A few simple yet effective strategies can make all the difference:
Verify insurance eligibility at every appointment – not just during intake. This helps catch changes like inactive coverage or mid-year plan updates before claims are submitted.
Get telehealth claims right. With telehealth now making up 40% of care [2], ensure you use the correct Place of Service codes (02 or 10) and modifiers (95 or GT) to avoid errors.
Standardize documentation. For time-based CPT codes (90832, 90834, 90837), always include precise session times. Missing timestamps are a common reason for claim rejections.
These steps might seem small, but they can dramatically improve your CCR and, in turn, your bottom line.
The claim denial rate measures the percentage of claims that payers reject. To calculate it, divide the number of denied claims by the total claims submitted. Alternatively, you can calculate it by dividing denied charges by total billed charges. This second method is particularly relevant in behavioral health, where a single denied residential stay might equal the revenue of dozens of outpatient sessions [6].
Denials create delays in cash flow and increase manual labor since each denied claim requires review, correction, and resubmission – or even a formal appeal. Alarmingly, up to 65% of denied claims are never resubmitted, resulting in permanent revenue loss [1].
Behavioral health practices face unique challenges when it comes to claim denials. Factors such as frequent authorization reviews, strict medical necessity evaluations using ASAM, MCG, or InterQual criteria, and mental health carve-outs – where a separate payer like Optum or Carelon manages behavioral health benefits – often lead to increased denials [5]. The most common denial codes in behavioral health highlight these specific hurdles:
Denial Code | Reason | Root Cause in Behavioral Health |
|---|---|---|
CO-197 | No authorization on file | Missing prior authorization or expired concurrent review [5] |
CO-50 | Not medically necessary | Documentation doesn’t meet ASAM, InterQual, or MCG criteria [5] |
CO-16 | Claim lacks information | Missing telehealth modifiers or rendering NPI [5] |
CO-B7 | Provider not certified | |
CO-18 | Duplicate claim | Common in group therapy or recurring IOP sessions [5] |
These codes show why proactive strategies are essential to reduce denials.
The industry standard for denial rates is below 5%, with top performers achieving rates between 2% and 4% [1]. However, many behavioral health practices report denial rates ranging from 10% to 15%, pointing to systemic issues rather than isolated mistakes [1].
Rather than focusing solely on fixing denials after they occur, prevention should be the priority.
To tackle denials, practices can take several steps:
Re-verify patient eligibility at every visit to identify carve-out changes in real time.
Set up an authorization hub that notifies staff when only 25–30% of approved sessions remain [7].
Train clinicians to document medical necessity based on payer-specific criteria rather than generic progress notes [1].
Follow the 7/30 rule: address denials within 7 days and file appeals within 30 days to recover lost revenue [6].
After examining clean claim rates and denial rates, the First Pass Resolution Rate (FPRR) takes accuracy analysis a step further. This metric reflects the percentage of claims that are fully paid on the first try – no need for corrections, appeals, or follow-ups. Unlike the clean claim rate, which only shows if a claim was accepted by the clearinghouse, FPRR reveals whether the payer actually processed and paid the claim. This makes FPRR especially important in behavioral health, where recurring sessions amplify the effects of billing mistakes.
In behavioral health, frequent therapy sessions, recurring intensive outpatient program (IOP) billing, and tricky prior authorization cycles open the door to compounded errors. Even small mistakes can lead to costs between $2.50 and $8.00 per claim. That’s why hitting the industry benchmark of 90% or higher is crucial to avoid a ripple effect of financial strain [1][3][8]. The best-performing organizations achieve rates above 95%, while an FPRR below 85% typically points to deeper billing issues [1]. If your days in accounts receivable (A/R) are increasing while patient numbers remain steady, a dropping FPRR is often the root cause [4].
To boost FPRR, focus on these strategies:
Verify insurance eligibility before every appointment and keep a centralized authorization log to reduce front-end mistakes [1][5].
Use automated claim scrubbing tools to catch payer-specific errors before submission [1].
Train staff to document medical necessity according to payer-specific guidelines instead of relying on generic progress notes. This ensures claims pass clinical reviews the first time [5].
Track FPRR by payer and service line to identify weak points in intake, coding, or documentation processes [3].
Days in Accounts Receivable (A/R) tracks the average time it takes for your practice to receive payment after submitting a claim or providing a service [1][4]. Essentially, it measures how quickly revenue flows into your practice. A higher number means slower collections, which can strain cash flow.
Behavioral health providers often face longer A/R cycles compared to other specialties. For instance, while general physician practices average around 21.9 days [8], behavioral health practices typically aim for 30 to 40 days [1][9]. This gap stems from several factors, including frequent recurring claims from weekly therapy sessions, the need to renew prior authorizations regularly, and increased scrutiny from payers on progress notes to confirm medical necessity. Additionally, Medicaid and state-contracted payers often have slower adjudication processes, further lengthening the cycle [9].
The financial stakes are high. For a practice generating $12 million annually, cutting Days in A/R by just 10 days can free up approximately $328,767 in working capital [9]. On the flip side, when Days in A/R exceed 50 days, it signals trouble. Claims outstanding for more than 90 days face a significant risk of going uncollected. A well-functioning practice typically keeps less than 15% of its total A/R in the 90+ day category.
To manage this effectively, it’s important to monitor A/R aging buckets – which categorize outstanding balances by age – so you can identify and address delays. Here’s a breakdown:
Aging Bucket | Action Standard | Risk Signal |
|---|---|---|
0–30 days | Monitor only (if the clean claim rate is >90%) | No immediate action required |
31–60 days | Begin active follow-up and verify receipt | Check for timely filing exposure |
61–90 days | Escalate to an A/R specialist and document contacts | Likely denial, authorization gap, or duplicate issue |
91–120 days | Prioritize appeals and review clinical documentation | Risk of closing the timely filing window |
120+ days | Evaluate for write-off or escalate to the patient | High write-off risk; requires root cause investigation |
These categories help pinpoint where claims are stalling so you can take targeted steps to reduce delays. For example, submitting claims within 24 to 48 hours of a patient visit and starting follow-up efforts at the 30-day mark can significantly improve collection times [1]. Additionally, segmenting A/R data by payer can reveal bottlenecks, while predictive tools can help prioritize high-value claims, cutting down on manual work [9].
Reducing Days in A/R isn’t just about improving cash flow – it also enhances overall efficiency and keeps your practice financially healthy.
After assessing how efficiently claims are processed and payments are collected, the net collection rate (NCR) provides a clear picture of how much revenue your practice is actually bringing in compared to what it’s contractually owed.
The formula for NCR is simple: (Payments Collected ÷ (Charges Submitted – Contractual Adjustments)) × 100 [1]. By excluding contractual write-offs, this metric gives an accurate snapshot of your practice’s revenue realization [1].
For behavioral health practices, NCR takes on added importance. With high volumes of recurring, session-based claims and frequent prior authorization needs, there are plenty of chances for revenue to slip through the cracks [1]. Ideally, your NCR should fall between 95% and 99%. Anything below 90% often indicates deeper systemic issues.
One common challenge is silent underpayments – when payers reimburse less than their contracted rates. Without regular comparisons to fee schedules, these discrepancies can go unnoticed [8]. A low NCR often points to problems like unworked denials, missed secondary billing, uncollected patient balances, or payers failing to honor contracts [8]. Alarmingly, up to 65% of denied claims are never resubmitted, which directly impacts revenue [1]. To address this, categorizing denials by reason and payer, and sharing that data with intake and clinical teams, can help reduce recurring errors [7].
On the patient side, improving communication about out-of-pocket costs before appointments and using tools like automated payment reminders through SMS or patient portals can boost collections for patient-responsibility balances [1]. Regularly reviewing your NCR and auditing payer contracts can help close the gap between what you’re owed and what you actually collect [1].
A high-performing NCR lays the groundwork for optimizing overall revenue cycle processes.
Understanding average reimbursement per service is key to evaluating the performance of individual services. To calculate this, divide the total payments received by the total number of services rendered. For accuracy, segment the data by CPT code and payer to see the full picture [1][2].
In behavioral health, reimbursement rates can vary widely depending on the service provided and the payer involved. For instance, a 90832 session (lasting 16–37 minutes) typically earns much less than a 90837 session (53+ minutes). Crisis psychotherapy under code 90839 falls into a completely different reimbursement range. Furthermore, even within the same parent insurer, payment rates might differ if behavioral health benefits are managed by specialty organizations like Optum, Carelon, or Magellan [5][4]. Without breaking down data by code and payer, these variations can easily go unnoticed.
One costly issue in this area is downcoding, such as billing a 90834 session instead of the higher-paying 90837 when appropriate. EliteMed Financials reports that this common error can cost a single clinician over $60,000 annually [11]. Another overlooked opportunity is the underuse of the Interactive Complexity add-on code (CPT 90785), which can add $15–$25 per session. Shockingly, this add-on is missed in an estimated 60%–80% of eligible cases [2][11].
To avoid these pitfalls, compare actual payments against each payer’s contracted fee schedule. If a payer consistently reimburses below the agreed rate, this is a clear case of underpayment and should prompt a formal dispute or contract renegotiation [1]. Additionally, if behavioral health reimbursement rates are consistently lower than comparable medical or surgical services, this could violate the Mental Health Parity and Addiction Equity Act (MHPAEA), providing legal grounds to address the issue [1][2].
No-shows and late cancellations can have a serious impact on revenue in behavioral health practices. These rates can range from 20% to 50% for mental health services and up to 50% in substance use disorder (SUD) treatment. Each missed session represents lost income – typically between $75 and $200 per hour [15]. For example, a clinician seeing 20 patients weekly with a 25% no-show rate could lose 5 billable hours every week. Since behavioral health billing relies on time-based CPT codes, empty slots mean no revenue [15].
Behavioral health patients often require 40 to 50 visits annually, far exceeding the 2 to 3 visits typical in primary care. This higher frequency of appointments magnifies the financial impact of missed sessions over time [1]. Monitoring no-show and late cancellation rates is essential for maintaining a healthy revenue cycle.
Key Metrics to Track
To better understand and address these challenges, use the following formulas:
Metric
Formula
No-Show Rate
(Total No-Shows ÷ Total Scheduled Appointments) × 100
Late Cancellation Rate
(Total Late Cancellations ÷ Total Scheduled Appointments) × 100
Tracking these metrics separately is important because they often point to different issues. No-shows can indicate forgetfulness or disengagement, while late cancellations might stem from scheduling conflicts, transportation issues, or dissatisfaction [12]. Data shows that 25% of clients miss sessions due to cost, 20% due to transportation issues, and another 25% due to scheduling conflicts [16]. Each of these reasons requires a different approach.
Strategies to Reduce No-Shows and Cancellations
Several interventions can help minimize these rates:
Automated Reminders: Use multi-channel reminders (email, text, or phone) sent at 72 hours, 24 hours, and the morning of the appointment. This creates multiple touchpoints between scheduling and the session [15].
Telehealth Options: Offering a telehealth alternative for last-minute conflicts can save the session from becoming a no-show [13][14].
Cancellation Policies: Establish a clear, written cancellation policy during intake. For patients with a history of missed appointments, requiring a deposit or prepayment can encourage accountability without feeling punitive.
Late Cancellation Fees: Research shows that implementing a late cancellation fee can reduce no-show rates by 14% [16].
This metric tracks the percentage of encounters where insurance coverage is verified and prior authorizations are secured. In behavioral health, mistakes here often lead to 100% claim denials with no chance for correction [11].
Verification errors make up 24.3% of all denials, while gaps in authorization and pre-certification add another 12.8% [8]. Combined, nearly 37% of denials stem from front-end verification issues – most of which could be avoided. In fact, 84% of denials could be prevented with better eligibility verification processes [8].
Behavioral health billing faces unique challenges. Many patients’ mental health benefits are managed by separate organizations – like Optum, Carelon, or Magellan – rather than their primary medical insurer. Billing the commercial parent plan instead of the carve-out administrator can result in costly errors [11]. Additionally, services such as Intensive Outpatient Programs (IOP) and Partial Hospitalization Programs (PHP) require concurrent reviews every 7–10 days. Missing a reauthorization window can halt payments mid-treatment [6]. These vulnerabilities highlight the importance of thorough front-end processes.
To improve accuracy:
Conduct eligibility checks 48–72 hours before each appointment, not just at intake, to catch coverage changes or lapses.
Train staff to identify separate behavioral health payer IDs on insurance cards to avoid carve-out errors [11].
Keep a centralized log of authorization details, including dates, session limits, and expiration triggers.
Start the reauthorization process when only 25%–30% of approved sessions remain to avoid gaps in coverage [7].
Metric | Target Benchmark | Warning Zone |
|---|---|---|
Eligibility Verification Rate | >98% (within 48 hrs of service) | Below 95% |
Prior Auth Approval Rate | 85%–96%+ | Below 75% |
Eligibility Denial Rate | Below 3% | Above 5% |
Strong authorization and eligibility accuracy is key to maintaining a healthy revenue cycle, ensuring that every service provided results in collectible revenue.
This metric measures how effectively practices collect copays, deductibles, and coinsurance from patients. With the rise of high-deductible health plans (HDHPs), this has become a critical indicator of financial health. As patients shoulder a larger portion of healthcare costs, uncollected balances can significantly impact a practice’s revenue. Ensuring a strong collection rate is essential for maintaining steady cash flow.
In behavioral health, the stakes are even higher. Therapists often see patients 40 to 50 times a year, so even small missed payments can quickly add up to major revenue losses [1]. Additionally, annual deductible resets – when patients suddenly face full out-of-pocket costs at the start of the year – create recurring challenges for cash flow.
Patient communication plays a big role in improving collections. Sensitive financial discussions and clear descriptions of services (e.g., “Individual therapy, 45 minutes”) help patients understand their responsibilities and pay their balances promptly [4]. Behavioral health billing also includes carve-outs, where mental health benefits are managed separately from medical coverage. If these carve-outs aren’t identified during intake, patients may face unexpected charges, reducing the likelihood of payment [4].
One effective strategy is collecting payments at the point of service (POS). Practices with POS protocols typically achieve 70%–80% collection rates. In contrast, those without clear communication or automated payment tools often fall below this range [1]. Offering proactive payment plans for patients with high deductibles can also prevent balances from aging while preserving the therapeutic relationship. Automated reminders via SMS or patient portals further encourage timely payments, reducing the risk of write-offs.
Metric | Target Benchmark | Warning Zone |
|---|---|---|
Patient Collection Rate | 70%–80% | Below 60% |
The readmission rate represents the percentage of patients who return to a behavioral health facility after discharge. It’s calculated using the formula: (readmitted patients ÷ total discharged patients) × 100 [12]. This metric serves as a key indicator of clinical quality and plays a significant role in revenue, especially in value-based care models where reimbursement depends on patient outcomes rather than the volume of services provided [12].
For Substance Use Disorder (SUD) clinics and Certified Community Behavioral Health Clinics (CCBHCs), high readmission rates often highlight shortcomings in discharge planning or follow-up care. Frequent patient returns can raise red flags for payers, especially when documentation lacks specificity. For instance, vague notes like “patient made progress” may not justify continued or repeated care [4]. By tracking readmission and return-to-treatment rates, clinics can better align clinical outcomes with reimbursement processes, boosting their revenue cycle management. This approach builds on the importance of strong documentation and authorization practices discussed earlier.
Outpatient clinics and Intensive Outpatient Programs (IOPs) are increasingly monitoring return-to-treatment patterns, even when not required for billing purposes. Doing so helps identify whether certain patient groups or diagnoses might benefit from more intensive care before a full readmission becomes necessary [12]. This proactive approach safeguards both patient care and clinic revenue.
One of the most effective ways to minimize billing risks is through high-quality documentation. Progress notes should clearly connect a patient’s diagnosis to their functional impairments, the interventions provided, and measurable treatment outcomes [4]. This level of detail ensures compliance with value-based contracts and reduces the likelihood of retrospective denials or revenue clawbacks [11].
Here’s a quick look at the clinical and financial significance of these metrics:
Metric | Clinical Impact | Financial Impact |
|---|---|---|
Readmission Rate | Reflects the success of discharge planning and follow-up care [12] | Influences reimbursement in value-based care models [12] |
Return-to-Treatment | Highlights the need for more intensive care or treatment adjustments [12] | Justifies continued care, reducing revenue loss [4] |
Medical Necessity Documentation | Aligns care intensity and frequency with the patient’s diagnosis [1] | Lowers the risk of denials and revenue recoupment [11] |
Together, these metrics provide a complete picture of your financial workflow, from scheduling appointments to collecting payments. While no single metric can capture everything, combining them helps identify potential issues before they disrupt cash flow. This highlights the importance of using a dedicated solution to stay ahead of challenges.
Every inefficiency in the billing process affects revenue. In fact, billing inefficiencies can drain 15–30% of collectible revenue, with many denied claims never recovered [1][11]. Regularly tracking metrics is the best way to avoid these costly losses.
Behavioral health billing comes with its own set of challenges, like session-based codes and carve-out networks, which require specialized management. To tackle these complexities, it’s essential to use a platform built specifically for behavioral health.
That’s where BHRev steps in. Its AI-powered claim scrubbing reduces errors, maintaining a clean claim rate of over 95%. Automated eligibility checks run 24–72 hours before appointments, cutting down on authorization-related denials. Real-time dashboards display key metrics like Days in A/R, Net Collection Rate, and denial trends without needing manual data exports. For practices dealing with aged A/R or patient collections, BHRev offers automated billing tools and an online payment portal to bridge the gap between billed charges and collected revenue.
Improving these metrics requires ongoing effort. As discussed earlier, practices that consistently review KPIs and follow the recommendations outlined in previous sections can collect 10% to 20% more of their revenue [11]. This financial stability allows them to focus on what truly matters: providing exceptional care.
When it comes to managing your revenue cycle, three metrics deserve your attention: days in accounts receivable, clean claim rate, and denial rate by reason. Why? Because these metrics directly impact cash flow, claim accuracy, and reimbursement efficiency.
Days in Accounts Receivable: This metric measures how quickly your organization collects payments after services are provided. Shorter collection times mean healthier cash flow and fewer outstanding balances.
Clean Claim Rate: A high clean claim rate indicates that claims are submitted correctly the first time, reducing rework and speeding up payment processes.
Denial Rate by Reason: Understanding why claims are denied helps pinpoint issues, whether they stem from coding errors, missing documentation, or payer-specific rules. Addressing these reasons can significantly improve reimbursement rates.
By keeping a close eye on these metrics, you can identify bottlenecks, minimize delays, and improve the overall performance of your revenue cycle.
To measure RCM metrics in your EHR or billing system, leverage its built-in reporting tools to pull essential data, such as service dates, payment dates, and claim statuses. Here’s how you can calculate a few key metrics:
Days in Accounts Receivable: Divide the total receivables by the average daily revenue. This gives you an idea of how quickly payments are being collected.
Clean Claim Rate: Measure the percentage of claims submitted without errors. A higher rate indicates fewer delays in claim processing.
Denial Rate: Calculate this by dividing the number of denied claims by the total claims submitted. It helps pinpoint inefficiencies in the claims process.
Accurate tracking of these metrics can provide valuable insights into the financial health of your practice.
To cut down on denials and speed up accounts receivable (A/R), prioritizing denial prevention is essential. Start by verifying patient eligibility for every visit to avoid unnecessary issues. Make sure to address any expired prior authorizations promptly and carefully review claims for errors before submitting them. It’s also important to monitor key metrics like denial reasons and days in A/R. This helps identify patterns and fix recurring problems. By following these steps, you can reduce claim rejections and improve cash flow more effectively.
One email a month, no fluff. Unsubscribe anytime.