
Home / Behavioral Health Billing KPIs: Trends to Watch

Behavioral health billing is under more pressure in 2026, and the first warning signs usually show up in a small group of KPIs.
Most teams only catch a problem once it’s already hit the bank account — by then, it’s harder to trace back to the cause.
That’s why it’s important to watch collections, denials, and AR aging together: that combination shows where revenue is slowing down, getting stuck, or slipping away entirely.
Here’s what to look at:
Net Collection Rate should stay around 95% to 99%
Days in AR should stay at 40 days or less
Clean Claim Rate and First-Pass Resolution Rate should stay at 90% or higher
Denial Rate should stay below 5%
Patient Collection Rate should stay at 70% or higher
Cost to Collect should stay around 3% to 4%
Why this matters now:
41.7% of privately insured people under 65 are in high-deductible health plans
Patient balance collection after service is only about 57%
Prior authorization drives 20% to 30% of denials
Behavioral health Days in AR now averages 65 to 75 days
Medicare’s telehealth in-person visit rule changed on January 31, 2026
If your denial rate is climbing, patient collections are falling, and 90+ day AR is growing, your cash flow problem has already started.
The trend matters as much as the number. A KPI dashboard only helps if I use it often, break it out by payer and aging bucket, and act when the numbers start moving the wrong way.
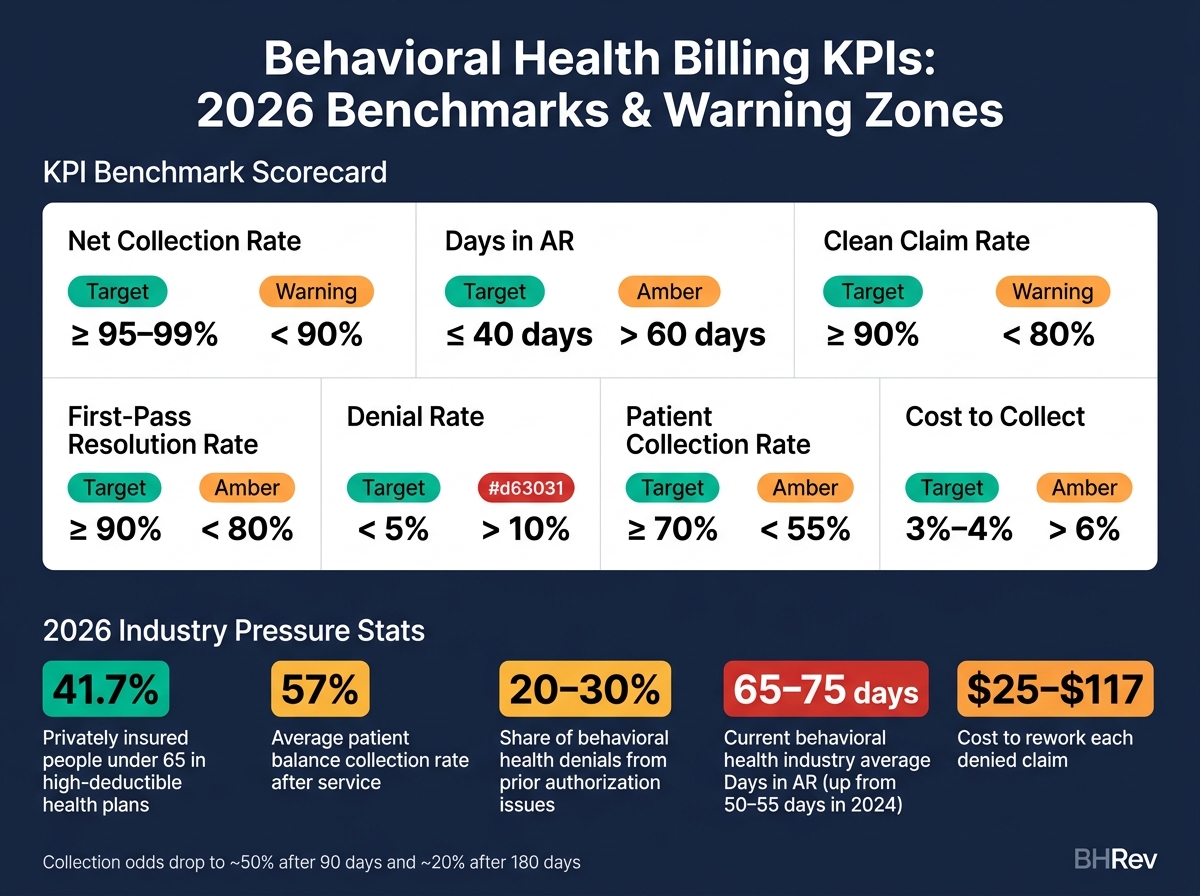
These KPIs show where billing pressure is building in 2026.
If cash is slowing down, these are the numbers that usually show you why. They help you see where revenue is getting stuck, delayed, or lost.
Net Collection Rate (NCR) is the most important metric in behavioral health billing. It shows the share of collectible revenue – after contractual adjustments – that your organization actually collects. The formula is (Payments – Refunds) ÷ (Charges – Contractual Adjustments).
Put simply, NCR tells you how much of the money you were supposed to collect actually made it in. High-performing behavioral health organizations usually target an NCR of 95% to 99% [3][1]. When it drops below 90%, that usually points to denials, underpayments, or both [1].
Days in Accounts Receivable (Days in AR) measures how long it takes to get paid after care is delivered. The formula is Total AR ÷ Average Daily Revenue. For behavioral health, the benchmark is ≤ 40 days [3][1].
That said, 2026 is telling a tougher story. The behavioral health industry average has climbed to 65–75 days, up from 50–55 days in 2024 [5]. When Days in AR starts creeping up, the cause is often delayed claim submission, weak follow-up, or payer slowdown. Breaking this number out by payer class – Commercial, Medicaid, Medicare, and Self-pay – makes it easier to see where the jam is happening [3].
These three metrics give you a quick read on front-end billing performance. If one slips, the others usually feel it too.
The Clean Claim Rate measures the share of claims that move through without errors or manual correction. In plain English, it shows claim accuracy before submission. The target is ≥ 90%, and top performers clear 95% [1]. If this rate drops, the problem often traces back to eligibility, coding, or documentation gaps.
First-Pass Resolution Rate (FPRR) tracks the share of claims paid on the first submission, with no rework or appeals needed. The benchmark is also ≥ 90% [1]. A low FPRR often points to missing authorizations or weak documentation.
The Denial Rate completes the picture by showing how often claims are rejected outright. Strong practices keep this below 5%, but many behavioral health organizations land between 10% and 15% [3][1]. And the cost adds up fast: denied-claim rework runs $25 to $117 per claim [1]. So even a small drop in denials can mean a meaningful dollar gain.
Once claim quality is under control, patient balances usually become the next cash-flow risk.
Patient Collection Rate measures the share of patient-responsible balances that are actually collected. The target is ≥ 70%, and the warning zone starts below 55% [1]. This matters more now because patient balances are larger than they used to be, and they get much harder to collect after the point of service.
Bad Debt Rate tracks the share of accounts receivable written off as uncollectable. The formula is (Total Write-Offs ÷ Total Accounts Receivable) × 100. When this number runs high, it often points to weak upfront financial counseling or too few payment plan options.
Timing matters here. Collection odds drop to about 50% after 90 days and 20% after 180 days [5]. That’s why it helps to track write-offs by reason and require appeal attempts before write-off [3][4].
Cost to Collect measures the administrative expense required to bring in revenue. The formula is (Total RCM Operating Expenses ÷ Total Collections) × 100. The target is 3% to 4% [1]. Organizations using automation report a cost-to-collect of 3.51%, compared with 3.74% for those without it [1]. That gap may look small at first glance, but it adds up over time.
Metrics like bad debt and cost to collect help confirm whether your upstream billing fixes are doing their job.
Use these thresholds to catch drift early.
|
KPI |
2026 Target Benchmark |
Warning Zone |
|---|---|---|
|
Net Collection Rate |
< 90% [1] |
|
|
Days in AR |
≤ 40 days [1] |
> 60 days [1] |
|
Clean Claim Rate |
≥ 90% [1] |
< 80% [1] |
|
First-Pass Resolution Rate |
≥ 90% [1] |
< 80% [1] |
|
Denial Rate |
> 10% [1] |
|
|
Patient Collection Rate |
≥ 70% [1] |
< 55% [1] |
|
Cost to Collect |
3%–4% [1] |
> 6% [1] |
These KPI trends show whether billing issues are one-off problems or signs of something bigger. When patient responsibility, denials, and AR aging all move in the wrong direction at the same time, cash flow is already feeling the strain.
What matters most isn’t any single metric. It’s the pattern across all of them.
As patient responsibility goes up, self-pay aging becomes one of the first places trouble shows up. If your patient collection rate drops below 70% and patient AR starts aging, weak benefit verification is often the root cause [1][4].
The numbers here are tough. The average patient balance collection rate after services are rendered is only about 57% [1]. And the longer a balance sits, the worse the odds get. Once it passes 90 days, collection odds fall to about 50%. By 180 days, they drop to roughly 20% [5].
That’s why it helps to watch patient AR aging next to your collection rate. Together, they show whether upfront financial workflows are doing their job or whether balances are slipping through the cracks.
If patient aging stays steady, the next place to check is usually the denial process.
A rising denial rate usually points to a workflow issue, not just a bad claim. Once it moves above 5% – and especially if it hits double digits – it often means there’s a system-level problem tied to authorization or documentation [3][2].
A big share of behavioral health denials comes from a few repeat trouble spots:
Prior authorization issues account for 20–30% of all behavioral health denials [2].
Medical necessity rejections make up another 25–35% [2].
Payers are paying closer attention to time-based psychotherapy codes, especially CPT 90832–90837, and checking start and stop times in clinical notes to confirm billed session length matches the record [2].
Overusing CPT 90837 without enough time-based documentation can lead to audits and broad denial patterns [2]. In plain terms, one weak process can snowball fast.
There’s also a hard dollar cost. Reworking each denied claim costs between $25 and $117 [1]. When denial rate and Days in AR climb together, it often means denials are sitting too long without follow-up and running into timely filing limits. At that point, a claim that could have been fixed turns into a permanent write-off [1][5].
If denials are under control, the next thing to watch is how long unpaid balances stay in AR.
Days in AR is one of the earliest signs of cash flow pressure. But by itself, it only tells part of the story. The clearer view comes from your AR aging buckets.
If more than 20–25% of total AR is over 90 days old, follow-up has likely broken down somewhere in the process [5]. That doesn’t always mean billing is failing, though. In growing practices, higher Days in AR can come from lagging credentialing for new providers rather than claim issues.
Here’s the tell: if the 0–30 day AR bucket is shrinking while total AR keeps growing, billing performance is getting worse, not just busier. Breaking AR down by payer class and service line makes it much easier to spot where the slowdown is coming from [3].
Once your KPIs are set, the next move is to turn them into a dashboard that catches drift early. That means teams should look at dashboards daily or weekly, not only at month-end. Daily dashboards should track the metrics that expose bottlenecks fast. Put simply, a KPI dashboard should show problems while there’s still time to fix them.
Break the dashboard out by payer class – Medicaid, Medicare, commercial, and self-pay – and by level of care, such as outpatient, IOP, PHP, and residential. Then layer in AR aging buckets: 0–30, 31–60, 61–90, and 90+ days. Treat 90+ day aging as a signal for immediate follow-up. This setup makes it much easier to see where cash flow is starting to stall.
Two things make a dashboard useful day to day: a reference point for alert thresholds and a trend tracker that shows month-over-month movement. The goal isn’t just to log monthly totals. It’s to see which way each metric is moving.
Monthly KPI Trend Tracker
KPI | Current Month | Prior Month | Status | Action Required |
|---|---|---|---|---|
Days in AR | 38 | 42 | Improving | Continue current follow-up cadence |
Denial Rate | 12% | 7% | Deteriorating | Conduct root cause analysis on top 3 payers |
Clean Claim Rate | 91% | 92% | Stable | Monitor for new payer-specific coding rules |
Patient Collection | 55% | 68% | Deteriorating | Review front-desk copay collection protocols |
This trend table helps you spot whether performance is getting better or starting to slip. A denial rate of 12% is a problem. But a denial rate that jumps from 7% to 12% in one month tells you something changed, and fast. That’s a clear sign of KPI drift [1][3].
Once the dashboard is live, automation can spot shifts between reviews. Manual reviews often catch problems after they’ve already grown. BHRev is built for behavioral health RCM and detects drift earlier in the cycle – before billing issues pile up into bigger cash flow trouble. The day-to-day edge comes down to speed: real-time alerts make it easier to act on patient billing trends, denial patterns, and AR aging before they get much harder to fix [1][5].
Once the dashboard is in place, the next move is to use what it shows. Across every metric in this article, one idea stands out: the direction of a KPI matters just as much as the number itself.
If a denial rate climbs from 4% to 7% over three months, that calls for faster action than a flat 8% rate [3]. The trend shows whether the billing operation is slipping and how fast that slip is happening.
In 2026, the KPIs that matter most are the ones tied straight to cash flow, denials, and patient payment behavior. They matter because they show where those parts of the revenue cycle are starting to strain.
The main question isn’t just whether a metric changed. It’s how fast it changed. The goal isn’t perfect scores. It’s quick action when the trend shifts.
High performers check dashboards often, look into drift early, and fix the process causing it.
Disciplined dashboard use – broken out by payer, program, and aging bucket – gives behavioral health leaders a clear view into payer and patient billing changes before those problems stack up. BHRev can surface denial patterns, AR aging shifts, and eligibility issues sooner. KPIs only matter when teams use them to move fast.
When the trend changes, the response has to change with it. Practices that treat KPIs as operating tools – not report cards – will respond fastest to 2026 billing pressure.
Start with your Net Collection Rate. It’s the clearest sign of your overall financial health because it shows how much expected revenue you actually collect after contractual adjustments. If that rate is low, it often signals deeper problems like denials, underpayments, or weak contract management.
Then look at your Denial Rate by payer and reason. That helps you spot workflow slowdowns, such as documentation gaps or authorization failures.
Review core billing KPIs daily so you can catch problems early and keep cash flow on steadier ground. When your team watches metrics like Days in Accounts Receivable, denial rates, and clean claim rates every day, they have more time to react before small issues turn into bigger ones.
Some metrics, such as Net Collection Rate, are often reviewed monthly because they’re better for spotting longer-term trends.
AR usually ages faster because of billing delays and day-to-day process gaps. Common causes include late claim submissions, incomplete or inconsistent clinical documentation, and missed or expired prior authorizations.
It can move even faster when teams do limited follow-up on unpaid claims, face heavy utilization review demands, or take a reactive approach to denial management. When claims sit unresolved, they can pass 90 days – and at that point, the odds of collecting drop sharply.
One email a month, no fluff. Unsubscribe anytime.