Home / Predictive Analytics for Medicaid Revenue Cycles
BLOG
Predictive Analytics for Medicaid Revenue Cycles
Forecast Medicaid behavioral health cash flow with 12–24 months of clean claims, eligibility, and remits to predict denials and auth gaps.
SHARE
If you bill Medicaid in behavioral health, small delays can turn into big cash problems fast.
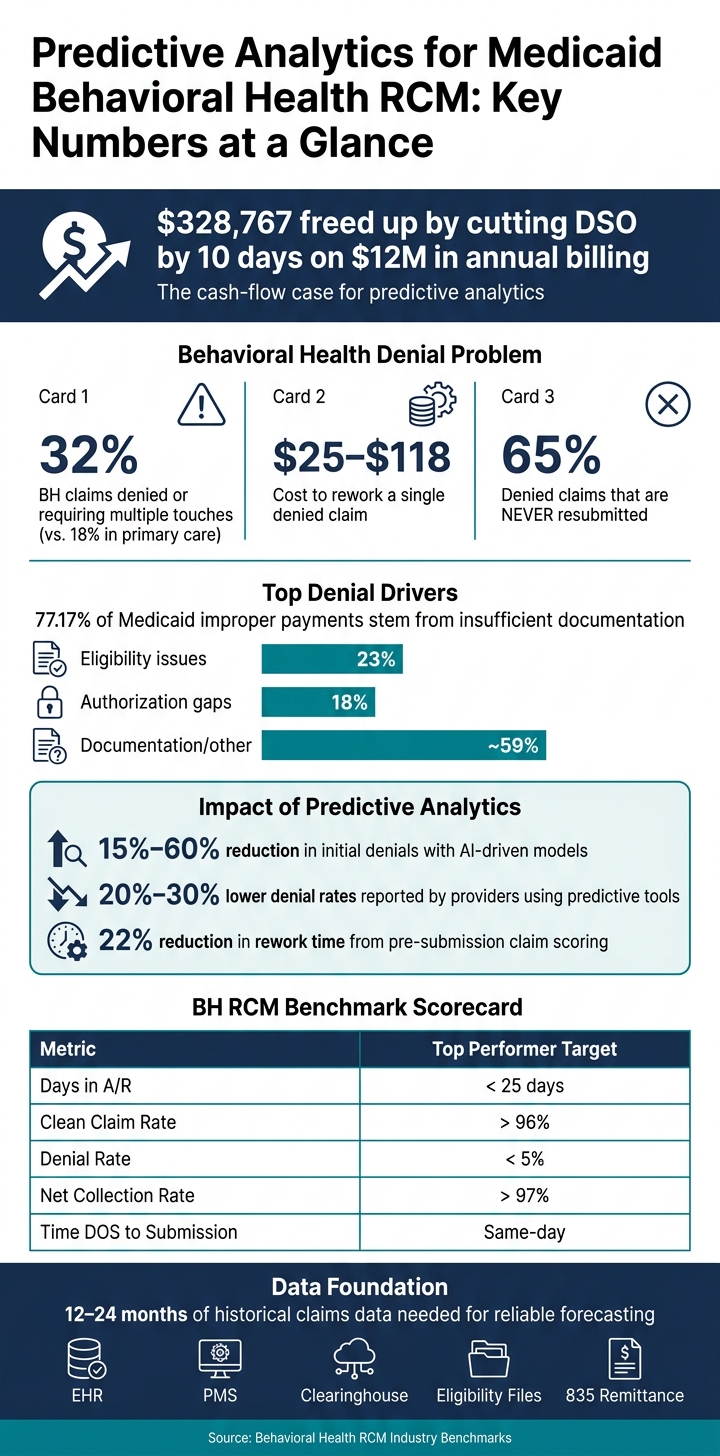
A provider with $12,000,000 in annual billing can free up about $328,767 by cutting DSO by 10 days.
Predictive analytics helps me spot denials before submission, eligibility lapses before service, and cash slowdowns before they hit the bank account.
For Medicaid RCM, that means using claims, remits, eligibility files, payer rules, and state-level patterns to forecast what is likely to go wrong and when money is likely to come in.
How to do it right:
Use 12 to 24 months of data to model denial risk, payment lag, and cash flow.
Focus on clean claims, remittance, and eligibility data first.
Add behavioral health fields like level of care, authorization status, telehealth modifiers, and payer plan.
Track state rules, MCO differences, filing limits, and redetermination cycles.
Watch high-impact KPIs like denial rate, clean claim rate, Days in A/R, and net collection rate.
Put model outputs into daily billing work so staff can review high-risk claims within 48 to 72 hours.
The main point is simple: better forecasting starts with better data, then moves into denial scoring, eligibility checks, and payment timing.
If you review results by state, month, and payer type, you can catch trouble earlier than if you only look at one system-wide average.
Medicaid Behavioral Health RCM: Key Predictive Analytics Stats & Benchmarks
The data needed to build accurate Medicaid forecasts
Accurate Medicaid forecasts start with clean claims, eligibility, and remittance data. If the underlying data is messy, the forecast will be too. Once that base is in good shape, the job shifts to modeling when Medicaid revenue comes in and where payment patterns change.
Core RCM data sources and metrics
Reliable Medicaid forecasts pull from Electronic Health Records (EHR), Practice Management Systems (PMS), clearinghouse reports, payer contracts for allowable rates and negotiated timelines, and eligibility files. Together, these inputs support revenue forecasts.
Those sources tie directly to the metrics that matter most:
Metric
BH Industry Benchmark
Top Performer Target
Days in A/R
< 30 days
< 25 days
First-Pass Clean Claim Rate
90%–95%
> 96%
Denial Rate
10%–15%
< 5%
Net Collection Rate
95%
> 97%
Most predictive models need 12 to 24 months of historical claims, denial, and payment data to spot dependable patterns and account for seasonal swings [4].
Raw RCM data almost always needs cleanup before modeling. Common problems include inconsistent payer names – for example, “UnitedHealthcare Community Plan” and “UHC Medicaid” may be logged as two different payers – along with missing fields and duplicate records [5].
Before modeling, standardize CPT and ICD-10 codes across all sources. Missing values should be imputed with rule-based estimates instead of being dropped, because removing records can skew the data. After that comes feature engineering: building inputs like prior denial rate by CPT-payer pair and documentation completeness score. These fields help improve forecast accuracy [5].
About 77.17% of Medicaid improper payments come from insufficient documentation rather than fraud [7]. That matters because documentation quality shapes what the model learns. When the data is structured well, seasonal and regional forecasting tends to be more dependable.
Behavioral health data fields that improve forecast accuracy
Standard RCM fields matter, but behavioral health billing has a few extra variables that can sharpen denial and payment predictions. Level of care is one of the biggest. Whether a patient is in a Partial Hospitalization Program (PHP), Intensive Outpatient Program (IOP), or residential setting can make a clear difference in forecast accuracy [6].
Authorization status and lag time also carry a lot of weight. Expired or missing authorizations are a major cause of reimbursement failure in behavioral health [6]. The same goes for telehealth status, modifier, and place-of-service code – if those don’t line up, denials can follow. Other high-impact fields include rendering provider type, payer plan, diagnosis clusters such as Serious Mental Illness versus Substance Use Disorder, and state, county, and managed care plan. These details help models separate high-risk claims from routine ones [5].
These fields matter even more when claim behavior shifts by state, plan, and season. With the right inputs in place, the next step is testing seasonal and regional patterns in payment timing.
How seasonal and regional trends shape Medicaid revenue
Once clean claims and payer data are in place, the next move is to model when revenue speeds up, slows down, or shifts by market. That matters because seasonal volume changes and state-by-state Medicaid rules can both change payment timing, denial risk, and cash flow.
Seasonal patterns in behavioral health billing and cash flow
Behavioral health billing doesn’t move in a straight line through the year. Volume often rises and falls with the school calendar, holiday cancellations, and weekend slowdowns. That’s especially common in pediatric behavioral health.
The pattern is uneven even within the same week. Monday brings about 18% of weekly collections, while Saturdays bring about 9% – a 2x difference [12]. And weekday submission habits can also change denial risk [10].
Looking at only one year of data can blur the picture. It may miss holiday timing changes, school-year cycles, and one-off events like the 2024Change Healthcareoutage[12]. In practice, those signals should sit inside the model as time-based features, while state policy differences belong in location-based features.
State and regional Medicaid differences that affect payment
Medicaid isn’t one system with one set of rules. Each state has its own fee schedules, prior authorization rules, documentation demands, timely filing limits, and MCO-specific policies.
That variation shows up fast in reimbursement. The same service can pay at 37% of Medicare rates in Rhode Island and 111% in Montana[13]. For providers working in more than one state, that gap hits net collection rate and cash-flow forecasting right away.
Timely filing rules add another problem. Medicaid filing windows usually range from 90 to 365 days, depending on the state, and MCOs often set shorter limits than the state fee-for-service program [13]. Miss that deadline, and revenue that could have been collected turns into a write-off.
Here’s a simple view of the state and regional factors that change the revenue cycle:
Regional/State Factor
Revenue Cycle Impact
Fee Schedule Level
Determines base reimbursement; rates vary widely by state [13]
Prior Authorization Rules
Drives authorization lag and denial spikes, especially for PHP, IOP, and residential levels of care [6]
Timely Filing Window
Ranges from 90 to 365 days; MCOs often impose shorter limits than state FFS programs [13]
MCO Enrollment Layer
Credentialing with the state does not guarantee enrollment in the MCO covering the majority of patients [9]
Telehealth Modifier Requirements
Modifiers like 95 and GT, along with place-of-service rules, vary by state and payer [6]
State-Directed Payments
Supplemental payments may be disbursed outside the claims process and may not appear in standard datasets [11]
There’s also more churn in the mix. Accelerated Medicaid eligibility redeterminations in 2026 are increasing Medicaid churn and making eligibility-related denials more common [2]. That’s why coverage checks at every encounter, not just at intake, can cut avoidable denials [9].
Model features to add for better regional and seasonal predictions
To model these patterns well, the feature set has to reflect both timing and geography.
State code and county are the starting point. Month of year and day of week capture the seasonal and weekly swings described above. Benefit year helps track annual coverage-cycle changes. And payer plan separates managed care behavior from fee-for-service, since MCOs and state programs often follow different denial logic and payment lag.
Feature Category
Specific Features
What They Improve
Seasonal
Month of year, day of week, holiday markers
Volume and cash-flow timing predictions
Regional
State code, county, urban/rural setting
Rate disparity and filing window accuracy
Payer
Payer plan, managed care vs. fee-for-service
Denial logic and payment lag estimates
More detailed location and payer inputs tend to sharpen forecast accuracy. They also give the model a better base for denial prediction, cash-flow forecasting, and staffing plans.
High-value predictive analytics use cases across the revenue cycle
Start with denial prediction. After that, focus on eligibility and authorization alerts, then payment forecasting. That order tends to drive the biggest gains for cash flow and staff time. It matters even more when seasonal volume shifts and state-level policy changes start pushing up denials, slowing payments, and straining teams.
Denial prediction and pre-submission prevention
Behavioral health claims fail far more often than claims in many other specialties. Nearly 32% of behavioral health claims are denied or require multiple touches, compared with 18% in primary care[5]. And every denial adds cost: reworking a denied claim runs $25 to $118, while up to 65% are never resubmitted[1][15][14].
A lot of these denials come from familiar trouble spots. In behavioral health, narrative documentation, medical necessity wording, and code mismatches often cause problems. Code pairs like 90837 and 90791 show up often as denial triggers [1]. On top of that, eligibility issues drive about 23% of denials, and authorization gaps make up about 18%[15].
This is where a pre-submission model earns its keep. A model can score each claim from 0 to 100 based on historical 835 remittance data, CPT/ICD-10 combinations, payer rules, and authorization status. High-risk claims go to manual review. Low-risk claims move through on their own. That simple split can cut rework time by about 22%[17][1]. NLP can also catch note-to-code mismatches before the claim is sent out [1][16].
Cash-flow and volume forecasting for staffing and budgeting
Once denial risk is in better shape, the next job is timing: when will cash actually hit the account? Time-series models like ARIMA and Prophet can project weekly and monthly receipts, along with DSO, by using past collection rates, payment lag trends, and visit volume patterns [5].
Volume forecasting solves a different day-to-day problem. If a model can estimate future patient encounters, behavioral health groups can line up clinician schedules and intake coverage with expected demand instead of scrambling later. Authorization risk alerts are especially helpful for services that depend on active prior authorization.
Use Case
Data Inputs
Model Outputs
Operational Action
Denial Prediction
Historical 835s, CPT/ICD-10 codes, payer rules
Risk score (0–100), error flags
Route high-risk claims to specialist review queues for manual fix
Authorization Risk Alerts
EHR schedules, payer auth policies, auth balances
Expiration alerts, missing auth flags
Pause session delivery or trigger immediate auth request
Cash Flow Forecast
Collection rates, payment lag patterns, visit volume
Projected weekly/monthly receipts
Adjust operating budgets or staffing levels based on cash
Eligibility Churn
Redetermination dates, patient activity logs
Coverage lapse probability
Proactive patient outreach for redetermination support
Automated mid-month eligibility re-checks, not just intake-day checks, are now a practical must because Medicaid redetermination cycles are moving faster [3].
Denial prediction and cash-flow forecasting become much more useful when they connect straight to the KPIs RCM teams already watch. Days in A/R, clean claim rate, and denial rate can all be projected forward. That gives teams a shot to step in before a metric slips, not after the damage is done.
Top behavioral health RCM teams aim for a denial rate below 5%, a clean claim rate above 96%, and days in A/R under 30 days[3]. BHRev puts this into day-to-day workflow: automated eligibility verification catches coverage lapses before services are delivered, AI-powered claim scrubbing applies risk scoring at submission, denial tracking shows payer patterns, and revenue forecasting dashboards give finance teams a live view of projected collections.
Use those outputs to set thresholds, assign owners, and trigger action. The next step is to define ownership, thresholds, and review cadence for each forecast.
Implementing predictive analytics and measuring results
Implementation steps, roles, and timelines
Once the forecast features are set up, the next move is simple: shift from model building to day-to-day use.
Start with a small pilot, like eligibility verification, and expand only after the model shows that it works. Use 12 to 24 months of cleaned claims, eligibility, and remittance data as the starting dataset.
Implementation Step
Responsible Roles
Typical Timeline
Goal Definition & KPI Selection
Leadership, Billing Manager
1–2 weeks
Data Centralization (EHR/Practice Management System Integration)
IT, Data Analyst
4–8 weeks
Dataset Preparation & Validation
Billing Lead, IT
2–4 weeks
Model Training & Pilot Testing
Data Scientist/Vendor, IT
4–6 weeks
Deployment into Work Queues/Dashboards
IT, Billing Staff
2–4 weeks
Continuous Monitoring & Recalibration
Policy Owner, IT
Ongoing (monthly)
After the pilot proves accurate, expand beyond eligibility checks into denial alerts and cash-flow alerts. Connect the model through API orFHIR so staff can see alerts inside existing billing queues. High-risk claims should be routed for review within 48 to 72 hours.
That shift matters. Instead of having billing teams touch every claim, the model helps narrow the workload to the exceptions that need human judgment.
Compliance, governance, and model oversight
Behavioral health teams need to stay aligned with HIPAA,42 CFR Part 2, the21st Century Cures Act, and state mental health regulations. In practice, that means using role-based access and keeping an audit trail for every model output that affects billing decisions.
Bias monitoring matters too. If a model keeps missing the mark for one patient group or one region, that’s not just a model issue. It can turn into a compliance problem and a fairness problem at the same time.
Model drift is another big maintenance concern. Recalibration should happen whenever state Medicaid policy changes, reimbursement rates shift, redeterminations move, or authorization rules change. Monthly KPI reviews are the practical way to spot drift before it hits cash flow, and a dedicated policy owner should monitor state-level Medicaid changes each week [3][2]. Manual review also plays a key role as payer rules keep changing.
Conclusion: Key metrics and actions that improve Medicaid revenue
Strong predictive analytics in Medicaid RCM usually comes down to three things: clean data, models that reflect seasonal and regional conditions, and predictions that feed straight into daily work.
Track results by state and month so teams can spot seasonal slowdowns and local policy changes early. The most useful metrics are often the same ones RCM teams already watch, but now the focus shifts from backward-looking reports to forward-looking targets. Organizations using AI-driven predictive analytics have seen 15% to 60% reductions in initial denials[4], and providers using predictive tools report 20% to 30% lower denial rates compared with baseline performance [8].
Use the dashboard to monitor denials, A/R, and submission lag by state and month. Forecasts reviewed at the state, month, and payer-type level, instead of only as a system-wide average, give teams the earliest signal that something is changing before cash flow starts to slip.
FAQs
How much historical Medicaid data do I need?
There isn’t one fixed requirement. But you do need enough historical data to reflect seasonal trends, payer-specific behavior, and policy shifts.
Put simply: solid forecasts come from a large, representative set of past reimbursement data, claim submissions, and remittance advice.
Because Medicaid rules change by state and managed care arrangement, your dataset should also include rate effective dates and cyclical eligibility changes. You’ll also want to keep that data updated over time so the forecast stays accurate.
Which Medicaid billing issues are easiest to predict early?
The Medicaid billing problems that are easiest to spot ahead of time usually follow repeatable patterns in claim history, payer behavior, and patient demographics.
That’s where predictive analytics helps. It can flag high-risk claims before submission, including:
Missing time-in/time-out details
Missing prior authorizations
Likely denials tied to certain CPT code and payer combinations
Possible eligibility or coverage lapses
Instead of finding these issues after a claim gets kicked back, teams can catch them earlier and fix them before they turn into delays or lost revenue.
How do state rules and seasonality affect cash flow forecasts?
State-specific Medicaid rules can make reimbursement harder to predict. Each state sets its own timely filing limits and managed care rules, and there’s no national standard to smooth things out.
That means providers often deal with different deadlines, different portal systems, and different claim requirements from one state to the next. The result? Payment delays of 30 to 60 days aren’t unusual.
Seasonality adds another layer of change. Patient payment habits shift throughout the year, and billing volume moves up and down too. BHRev uses predictive analytics to spot payer delays and seasonal patterns, which helps providers forecast cash flow with more confidence.