Home / Top Features of AI Financial Dashboards for RCM
BLOG
Top Features of AI Financial Dashboards for RCM
AI dashboards convert behavioral-health RCM into a control center—prevent denials, forecast cash, and recover 10–15% more revenue.
SHARE
If you run behavioral health billing, the best AI dashboards help you stop denials before claims go out, track cash in real time, and find revenue that slips through.
In many cases, teams using this kind of billing system see 10%–15% more recovered revenue in the first 90 days, denial rates drop from 15%–20% to about 7%, and days in A/R can fall below 25.
Look for a dashboard that helps with the full revenue cycle, not just reporting.
That means it should help you:
See live revenue data instead of waiting for month-end reports
Track core KPIs like days in A/R, clean claim rate, and net collection rate
Check eligibility early and flag coverage issues before visits
Monitor prior authorizations and expiring units
Scrub claims with payer-specific billing rules
Spot denial patterns and route work by root cause
Score claims for denial risk before submission
Forecast cash flow based on claim and payer data
Catch underpayments and missed revenue
Track compliance across Medicaid, Medicare, and commercial plans
For behavioral health, this matters more because billing is tied to session limits, re-authorizations, telehealth rules, carve-outs, per-diem programs, and signed notes.
A plain dashboard that only shows old numbers is not enough.
Quick Comparison
Feature
What it helps with
Main metric
Real-time revenue visibility
Live view of claims, A/R, and cash movement
Cash collections
KPI tracking
Day-to-day billing performance
Days in A/R, clean claims
Eligibility alerts
Coverage checks before service
Eligibility denial rate
Authorization monitoring
Approved visits and unit tracking
Auth-related denials
Claim scrubbing
Pre-submission error checks
Clean claim rate
Denial analysis
Root-cause review after denial
Denial rate
Risk scoring
High-risk claim review before filing
First-pass acceptance
Cash flow forecasting
Expected payments by payer and claim mix
Forecasted collections
Leakage detection
Underpayments, missed charges, lost follow-up
Net collection rate
Compliance reporting
Audit readiness and payer rule checks
Billing accuracy
Bottom line: Whenreviewing AI financial dashboards for RCM, Iaim for one system that helps the front desk, billers, and leadership work from the same live data.
That is what turns billing from a report you read later into a tool you use every day.
Why Behavioral Health Organizations Need AI-Driven Financial Dashboards
Behavioral health billing revolves around recurring care: therapy, IOP, PHP, residential per diem stays, and telehealth. Each of those services comes with its own documentation rules, authorization steps, and payer limits.
Behavioral Health Billing Has More Moving Parts Than Standard Practice Billing
Medicaid and Managed Care Organizations (MCOs) often use carve-outs, session caps, and reimbursement rules that differ from commercial payers [5]. On top of that, the same service may bill in different ways based on the clinician’s license and the payer’s rules. So this isn’t just about checking eligibility. Authorization tracking matters just as much.
Authorization is a steady pain point. Behavioral health rarely deals with a one-and-done pre-authorization. More often, teams have to handle repeat re-authorizations tied to treatment plans and diagnosis updates. When an authorization expires, claims get denied. And there’s another snag: claims usually can’t go out until the clinician finishes the session note. If documentation piles up, cash flow slows down with it [9].
Month-End Reports Are Too Slow for Effective RCM
Delayed reporting gives small issues time to turn into aged denials. By the time a month-end report shows an eligibility lapse or an authorization gap, the claim has often already been sent, denied, and left to age [5][10]. That lag creates avoidable rework. A spreadsheet can tell you what went wrong last month. It can’t help your team stop tomorrow’s denial.
Smarter dashboards make eligibility results simpler to read and easier to act on.
AI Dashboards Connect Financial Data to Day-to-Day Action
An AI-driven dashboard can show risk early and point each team toward the next step. Front-desk staff can spot scheduled patients with unverified insurance or authorizations close to expiring. Billers can flag claims with high denial risk before submission. Managers can review A/R performance by location, program, or clinician without pulling a stack of separate reports.
That’s a big deal for multi-site organizations. Different teams need different information, and they need it at the moment it matters.
The next requirement is live visibility into revenue as it changes.
BHRev replaces static reports with live A/R, denial, and payer dashboards built for behavioral health RCM [1]. That means teams can see what’s happening now, not after the fact. Clients typically stay under 25 days in A/R[1].
You can also track Net Collection Rate and Charge Lag – the time from service to charge entry – to catch cash flow slowdowns early [9]. In behavioral health, that kind of visibility can’t stop at claim totals. It also needs to show authorization status and visit patterns.
Behavioral Health Specificity
BHRev’s dashboard tracks Authorization Status, including active versus expiring authorizations, plus used and remaining units [5][7][9]. That gives teams a clear way to catch expirations before service and avoid denial.
It also surfaces No-Show and Cancellation Rates[5][7][9]. That matters because missed appointments bring in no revenue and can throw off cash flow forecasting.
Actionable AI Automation
Role-based views help each team focus on the data that matters most. Front-desk staff can see eligibility status and authorization expirations, while billing teams can zero in on claim errors and payer-specific denial trends [5][9].
Automated alerts add another layer of control. Teams get notified when the clean claim rate drops below target or when an authorization is within 10 days of expiration [5][9].
2. Dynamic KPI Tracking for A/R, Denials, and Collections
Revenue Impact
Track the KPIs that have the biggest effect on cash flow: Days in A/R, Clean Claim Rate, First-Pass Acceptance Rate, and Net Collection Rate. Good targets are under 40 days in A/R, 90%+ clean claims, 95%+ first-pass acceptance, and 95%+ net collection[12].
These numbers give teams a live view of collection health before small issues turn into older claims and denials.
Some integrated behavioral health RCM systems report average days to pay as low as 18 days[4]. That’s a strong benchmark. From there, the next move is simple: use those KPIs to spot denial risk early.
Denial Prevention
Denial rate is one of the most important KPIs in behavioral health RCM. The goal is to stay under 5–7%, while average denial rates in healthcare often sit between 5% and 10%[12][15].
An AI dashboard that groups denials by reason code helps the team see what’s going wrong. Is it an authorization lapse? Missing documentation? A credentialing gap? That kind of view points people to the right workflow instead of sending them on a wild goose chase.
For behavioral health, the best dashboard setup goes past standard billing metrics.
Behavioral Health Specificity
Track Documentation Lag, Authorization Compliance, and 90+ Day A/R as a share of total A/R[9][14]. These metrics can show risk before cash flow takes the hit.
Example: a substance use center used segmented dashboards to find residential claims averaged 38 days in A/R versus 21 for MAT, prompting staffing and payer changes [9].
That kind of split matters. If one service line gets paid in 21 days and another takes 38, the issue usually isn’t random. It points to a process, payer, or staffing problem that needs attention.
Actionable AI Automation
Once thresholds are set, the dashboard can route work on its own. AI dashboards can flag when the clean claim rate drops below 85%[9][12], route aging claims into priority queues [2][3], and alert billing teams when admission-to-billing lag exceeds 72 hours[12].
Drill-down views make it easier to pinpoint the source of a denial spike, whether it’s tied to a provider, location, or payer[9][14].
3. AI-Powered Eligibility Verification Alerts
Revenue Impact
Eligibility mistakes are one of the biggest reasons behavioral health claims get denied or held up. And that hits cash flow fast. For a clinic with $3 million in annual revenue, recovering just 10% of eligibility-related denials can mean $24,000 per month in recaptured collections [18].
Denial Prevention
AI-powered verification can cut eligibility-related denials by 60% to 85%[17]. The timing here matters a lot. Run checks when the visit is scheduled, again 48 to 72 hours before the appointment, and one more time on the day of service. That extra step helps catch coverage changes before they turn into denied claims [17][12].
Behavioral Health Specificity
Behavioral health benefit checks go far beyond a basic yes-or-no eligibility status. A well-set-up AI dashboard can verify level-of-care (LOC) benefits across PHP, IOP, residential, and outpatient settings. It can also check session caps, carve-outs, the right telehealth modifiers and place-of-service codes, and single-case agreements [7][12].
For Medicaid patients, the details get even trickier. The system should flag MCO-specific rules and waiver authorizations that generic tools often miss [12][5].
Actionable AI Automation
Verification is only part of the job. AI dashboards can also work like automated monitors, running parallel payer checks at a scale manual teams usually can’t keep up with. In practice, that means handling 10 to 15 times more verifications per staff member[17].
BHRev supports multi-payer eligibility checks, LOC rules, and real-time alerts in one dashboard.
Once eligibility is confirmed, the next move is to track prior authorization and benefits before the claim is created.
4. Prior Authorization and Benefits Monitoring
After eligibility, authorization becomes the next gate for billable care.
Eligibility tells you whether coverage exists. Authorization decides how much care can actually be billed.
Revenue Impact
AI dashboards track active, expiring, and exhausted authorizations so teams can use approved visits before they lapse [5][7].
Denial Prevention
In behavioral health, missing or expired authorizations are a major reason claims get denied. AI dashboards help prevent that with an authorization tracker that shows active, expiring, and exhausted authorizations, so teams can lock in renewals before a denial happens [5].
A simple rule works well here: set alerts 10 days before an authorization expires. That gives the utilization review team time to contact the payer and renew coverage [5].
Behavioral Health Specificity
Behavioral health teams need to track level-of-care changes and authorized-unit balances across:
IOP
PHP
Outpatient therapy
Group sessions
Residential care
This matters even more in residential care. Teams need to watch concurrent reviews closely: how many days are authorized, when the next progress review is due, and whether the clinical documentation supports the renewal request [7][4].
Medicaid can make things messier. Some MCOs require pre-authorization for every individual therapy session, and carve-out rules can change from one plan to another [5].
That setup helps teams catch renewals before visits become unbillable.
Actionable AI Automation
Tracking is only part of the job. AI automation can also take over the repetitive tasks. RPA bots can refresh authorization status, flag expiring units, route renewals before service, and then update the EHR [12]. Front-end fixes like these can reduce overall claim denials by up to 20% [13].
BHRev includes prior authorization monitoring within its behavioral health RCM workflow.
5. Automated Claim Scrubbing with Payer-Specific Rules
Once eligibility and authorization are in place, claim scrubbing is the next checkpoint. It catches errors before a claim goes out the door.
Denial Prevention
A claim can still get denied for simple but costly issues: the wrong modifier, a place-of-service code that doesn’t match, or session time that doesn’t line up with the billed CPT code.
AI scrubbing checks for these problems before submission in one automated pass. It runs format checks, clinical rule validation, and payer-specific edits at the same time. That means it can flag things like:
telehealth modifier issues, such as 95 vs. GT
incorrect NPI/taxonomy combinations
authorization mismatches
Behavioral Health Specificity
Behavioral health claims need more than basic formatting checks. The rules are tighter, and the edge cases pile up fast.
Behavioral health scrubbing should validate group therapy attendance and facilitator credentials, residential and PHP per-diem rates, and MBHO carve-outs when behavioral health is carved out from the medical plan.
Organizations using specialized behavioral health RCM platforms report average clean claim rates of 94%[1][4]. High-performing operations can push that above 97%[6]. Automated scrubbing can also cut denial rates from 15%–20% to about 7%[4].
Actionable AI Automation
Generating claims from signed clinical documentation cuts manual errors [7][6]. It also helps keep charge lag inside the 1–3 day best-practice window [6].
Payer-specific rule libraries manage variation across state Medicaid plans, MCOs, and commercial payers, so the same workflow can apply the right checks for each payer [7][12].
That kind of consistency turns scrubbing from a manual chore into a repeatable workflow. BHRev applies behavioral-health-specific claim scrubbing across Medicaid, Medicare, and commercial plans.
6. Denial Pattern Analysis and Root-Cause Detection
Claim scrubbing helps catch errors before a claim goes out. Denial analysis tackles a different problem: why the same denials keep showing up. If denials still happen, the dashboard needs to make the reason plain.
Revenue Impact
Behavioral health denial rates remain higher than in most medical specialties [8]. Denials and payment delays can cost providers about $500,000 per year, and most of those losses are preventable [18].
Behavioral Health Specificity
In behavioral health, denial patterns often pile up around the same trouble spots: authorization gaps for PHP, IOP, and residential programs, expired authorizations still linked to active sessions, telehealth modifier mismatches (95 vs. GT), H-code errors for substance use disorder services, and documentation that doesn’t clearly support the billed level of care [8][12][20].
AI dashboards built for behavioral health can break denial trends out by service line – therapy, psychiatry, and SUD – because a problem in one area may have nothing to do with another. They also line denials up with Claim Adjustment Reason Codes (CARC), which groups denials by cause [20].
CARC mapping turns denial codes into work queues teams can actually use.
Once those patterns are visible, AI can group denials by payer, clinician, and cause, then send each claim to the right owner. In plain terms, that means eligibility denials go to the front desk, while coding denials go to the billing lead [12].
BHRev’s denial tracking and appeals workflows use this logic across Medicaid, Medicare, and commercial payers, which helps teams stay organized without manual triage.
Once root causes are clear, the dashboard can score new claims before submission.
7. Predictive Denial Risk Scoring
Once denial patterns are clear, the next move is simple: score claims before they’re submitted. Denial pattern analysis shows why claims fail. Predictive risk scoring helps stop those claims before they go out.
Denial Prevention
AI risk scoring checks each claim against past denial data, payer-specific rules, and eligibility status in real time. Think of it as a pre-submission risk screen. It catches errors before they turn into rejections [11][20].
Behavioral Health Specificity
Generic risk scoring often misses behavioral health billing rules that can trip up a claim. A strong model flags CPT length mismatches, ASAM documentation gaps, add-on code issues, Part 2 restrictions, and authorizations with units that are about to expire before submission. That makes the score useful at the point when staff can still fix the claim.
Actionable AI Automation
A risk score means little if no one acts on it. When a claim scores high, the dashboard should send it to the right person and show a clear reason, not just flash an alert. The goal is pre-submission correction: scoring, routing, and claim review before anything is sent.
BHRev uses this predictive layer across Medicaid, Medicare, and commercial payers to help teams fix the right claims before submission.
8. Cash Flow Forecasting
After claims are risk-scored, the dashboard can start estimating when cash is likely to hit the account.
Revenue Impact
Aging buckets tell you how old a claim is. They do not tell you how likely it is to get paid.
That’s the gap AI forecasting helps fill. Instead of treating all A/R the same, it uses probability-weighted revenue estimates. Each claim is scored based on its chance of payment, not just the number of days it has been sitting out there.
The result is a clearer view of expected incoming cash. Leadership isn’t stuck looking at gross A/R that may never turn into actual dollars.
Behavioral Health Specificity
In behavioral health, that forecast needs to reflect the messier parts of revenue, too. It should account for no-shows, cancellations, authorization expirations, session limits, Medicaid carve-outs, and group-therapy revenue.
It also helps to pull in verification-of-benefits (VOB) data, including deductibles, copays, and patient responsibility. That way, the forecast reflects both insurer payments and what the patient is expected to pay.
Actionable AI Automation
BHRev’s revenue forecasting connects payer-level days to payment with live claim pipeline data to project collections earlier [5].
If a payer starts slowing down, the dashboard can flag the issue early. That gives the team time to follow up before the delay turns into a cash crunch.
Used well, this forecast can shape day-to-day decisions across:
staffing
scheduling
payer follow-up for Medicaid, Medicare, and commercial payers
9. Revenue Leakage and Underpayment Detection
Once denials are handled, another problem shows up: revenue that leaks out through underpayments or claims that never make it back into the system.
Not all lost revenue appears in a denial report. Some of it slips away through underpayments, missed charges, or claims that never get resubmitted.
Revenue Impact
Without automated reconciliation, behavioral health groups can miss resubmissions and underpayments that never appear in denial reports. Net Collection Rate should stay between 95% and 99%. If it falls below that range, that’s a sign of leakage [21][22].
Behavioral Health Specificity
Behavioral health brings its own leakage risks, and AI dashboards should catch them early. Teams should be able to see these variances by code, payer, and service line.
Session-length mismatches: Billing a 60-minute psychotherapy session (CPT 90837) as a 45-minute session (CPT 90834) can cut reimbursement [11].
Authorization overruns: Services delivered after authorized units are used up can turn into unbillable claims [5][12].
Telehealth modifier errors: Using the wrong modifier, such as 95 instead of GT, or the wrong Place of Service code can lead to underpayments [12].
MAT bundling changes: Shifts between bundled and unbundled reimbursement for medication-assisted treatment can create silent underpayments [12].
Actionable AI Automation
An AI dashboard should compare ERA payments against payer fee schedules and flag underpayments, contract variances, and low-paying payers in real time [11][19]. BHRev’s underpayment recovery tools surface those variances, while payer scorecards help teams spot payers that keep paying below contracted rates [5][21].
10. Compliance Reporting Across Medicaid, Medicare, and Commercial Payers
Compliance reporting helps protect reimbursement and keeps teams ready for audits. In practice, that means compliance data belongs in day-to-day RCM work, not in some separate audit file that only gets attention later. Behavioral health providers have to keep up with CMS, Joint Commission, HIPAA, and 42 CFR Part 2 at the same time [5][10].
Revenue Impact
When teams check dashboards on a regular basis, they can improve financial reporting accuracy to 95% and cut operating costs by 30%[10]. That matters because small misses can turn into direct revenue loss. A late note, for example, or a Medicaid MCO authorization rule that someone reads the wrong way, can trigger post-payment takebacks. Money that looked booked and done suddenly gets pulled back.
Denial Prevention
A lot of denials are preventable if teams catch issues early. Flag unsigned notes within 24–48 hours and spot inactive credentials before claims go out. Both problems can stop payment cold. Each miss can turn into a delay, a denial, or a takeback.
Behavioral Health Specificity
Behavioral health dashboards need to do more than cover standard HIPAA safeguards. 42 CFR Part 2 adds another layer, especially for SUD records. It requires consent tracking and limits what can show up in automated notifications [12]. That is where role-based access control matters. Billing staff can view claim status without seeing full clinical records, while clinical leaders can track documentation timing without seeing full billing history [5].
Actionable AI Automation
BHRev’s compliance-focused workflows manage payer-specific rules for Medicaid carve-outs, MCO requirements, and commercial session limits [5][12]. The platform also keeps immutable audit logs showing who accessed or edited clinical and billing data, which helps during Joint Commission and CARF accreditation reviews [12][7].
It also sends automated alerts when:
a clinician’s documentation backlog goes past 48 hours
These controls should sit right next to A/R, denials, and cash flow in the same dashboard. The next step is comparing which dashboard features support each part of the revenue cycle.
Feature Comparison Table
The table below compares the ten features by stage, function, KPI, and outcome. It gives you a side-by-side view of how each one fits into the revenue cycle.
AI Dashboard Feature
Primary Function
Main KPI Affected
Financial/Outcome Example
Real-Time Revenue Visibility
Leadership Oversight
Cash Collections
Identify $125,000 in unbilled charges in real time
Ensure 100% modifier accuracy (e.g., GT, 95) for July billing
Three patterns stand out: prevention, recovery, and oversight.
That’s the big takeaway from the table. Each feature plays a different role at a different point in the revenue cycle. But when they work together, the impact stacks up. The next section shows how these features connect before, during, and after the claim.
How These Features Work Together Across the Revenue Cycle
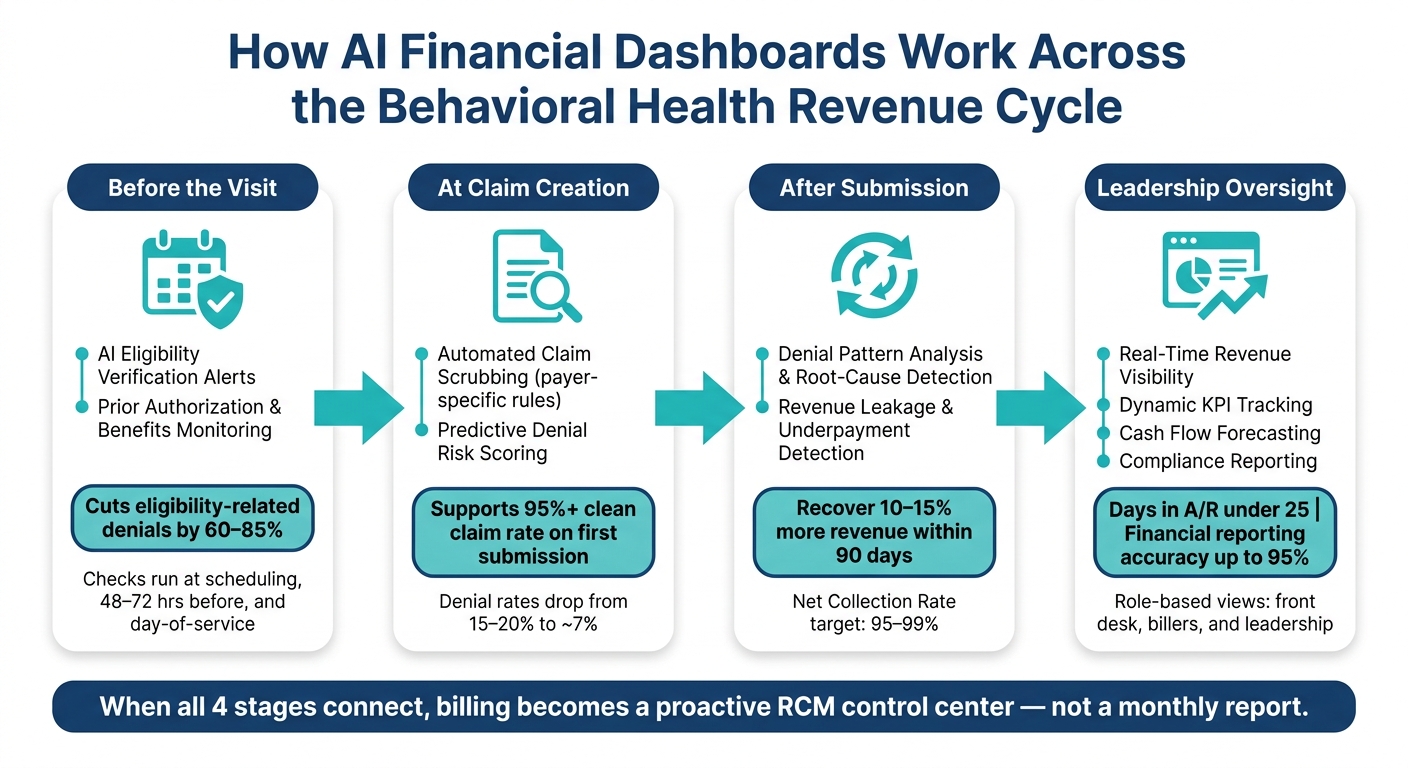
AI Financial Dashboard: RCM Workflow for Behavioral Health Billing
The table above explains what each feature does. This section shows how they connect from one RCM stage to the next. When a dashboard is set up well, it ties the whole process into one closed loop.
Before the Visit: Eligibility and Authorization Checks
Eligibility verification and authorization tracking happen before care is delivered. These front-end checks help stop avoidable denials before a claim is even created. The data gathered here then flows into claim creation.
At Claim Creation: Scrubbing and Risk Scoring
Once a clinician signs a note, claim scrubbing checks the claim against payer-specific rules before submission. Predictive denial risk scoring then flags higher-risk claims for review, using the same eligibility and authorization data collected earlier. Put simply, one step cleans the claim, and the next step spots trouble before it spreads.
Scrubbing plus risk scoring can help support 95%+ clean-claim rates.[12] Claims that clear this stage move into adjudication with less rework.
After Submission: Denial Analysis and Recovery
After submission, the dashboard follows each claim through adjudication. If a denial comes back, AI sorts it by root cause and sends it to the right team member. That matters because it ties the denial back to the earlier breakdown, so the same error doesn’t keep showing up across hundreds of claims.
Facilities using AI-powered billing intelligence typically recover an average of 10–15% more revenue within the first 90 days of implementation.[2] The same claim and denial data also feeds leadership reporting.
For Leadership: Forecasting and Compliance Oversight
Leadership works from the same data through A/R, payer, and cash flow views. Role-based access keeps each view focused:
Taken together, these features shift the dashboard from a simple reporting screen into an RCM control center. The strongest dashboards help teams manage each part of the revenue cycle, from eligibility checks all the way to executive forecasting.
For behavioral health organizations, month-end reporting shows up too late to stop denials, expired authorizations, and cash flow slowdowns. And that has a direct effect on payment. Authorization renewals, payer rules, and compliance checks all shape whether services get reimbursed. A proactive approach means spotting problems before claims go out. Facilities using AI-powered billing intelligence often recover 10–15% more revenue within the first 90 days[2].
For behavioral health teams reviewing AI financial dashboards, BHRev brings these functions into one platform: eligibility alerts, claim scrubbing, denial management, predictive analytics, and payer-specific compliance reporting.
FAQs
How does an AI dashboard reduce denials?
AI dashboards help cut denials by spotting errors before claims go out and by showing why those denials happen in the first place. They pull data from EHRs and payer portals to flag missing documentation, invalid codes, and prior authorization gaps.
BHRev supports this with claim scrubbing and denial workflows, so teams can fix problems at the source. The result is better clean claim rates and a clearer view of issues in real time.
Which KPIs matter most for behavioral health RCM?
The most important behavioral health RCM KPIs track both financial and day-to-day performance. The main ones to watch are:
Clean claim rate
Days in accounts receivable
Denial rates with root-cause categories
Net collection rate
Authorization status, expiration dates, and unit limits
It also helps to track no-show and cancellation rates, therapist productivity, and payer mix. BHRev helps providers improve these numbers with specialized, real-time dashboards and analytics.
How quickly can a dashboard improve cash flow?
Behavioral health organizations often see measurable gains in cash flow and collections within 30 to 90 days of putting a real-time revenue cycle management dashboard in place.
With instant visibility into metrics like days in accounts receivable, denial trends, and authorization status, these dashboards help teams act sooner on billing issues, cut revenue leakage, and recover aged accounts receivable faster.